
Freight Forwarder KPIs and BI Dashboards 2026: The 12 Metrics Forwarders Actually Track

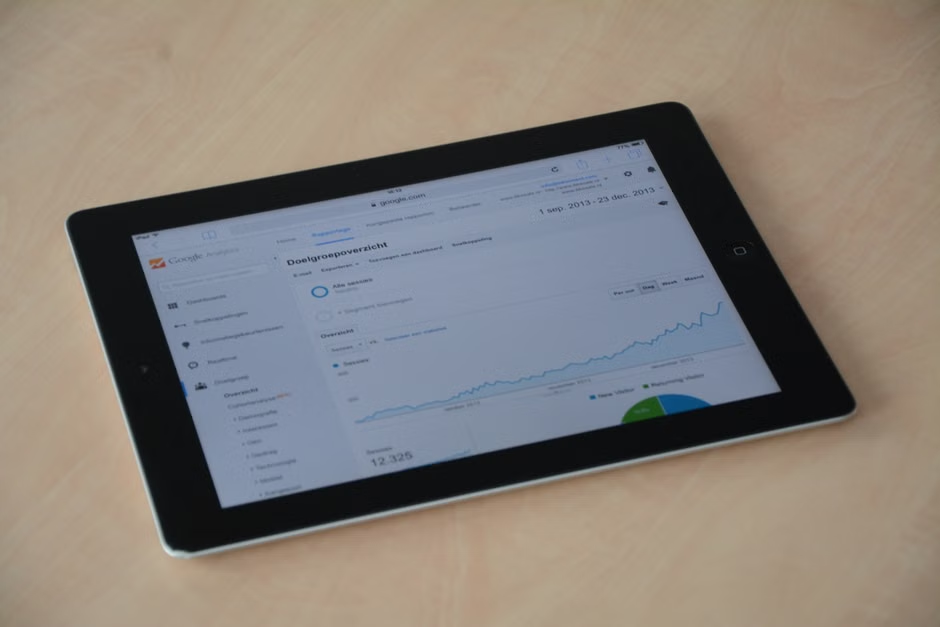
Ask five forwarder CEOs which KPIs they track weekly and you will get five different lists. Ask their CFOs and the lists narrow. Ask their operations managers and the lists narrow again, because the numbers that actually move the P&L are the same across most freight forwarders. Gross margin per shipment. Quote to book conversion. AR days. Container utilization. On time delivery. Revenue per employee. The rest is commentary.
The problem is not that forwarders do not know what to measure. The problem is that the numbers live in spreadsheets that refresh once a month, sourced from an operations system that holds the shipment file and an accounting system that holds the invoice, with the reconciliation done by a controller at month end. By the time the KPI report is circulated, the shipment that bled margin is already invoiced and the customer that stopped booking has already gone quiet. A BI dashboard wired into the freight management system closes that gap by pulling the same 12 KPIs from the source data every day.
Key Takeaways
- Twelve KPIs cover almost every question a forwarder CEO, CFO, COO, sales director, or ops manager asks about the business: gross margin per shipment, gross margin percentage, revenue per employee, quote to book conversion, quote turnaround time, booking to invoice cycle time, AR days outstanding, on time delivery rate, container or AWB utilization, cost per shipment, customer concentration, and vendor concentration.
- Healthy benchmarks are tight. Gross margin per shipment $250 to $800 on mixed ocean and air. Gross margin percentage 15 to 22 percent. Revenue per employee $250K to $500K. Quote to book conversion 25 to 40 percent. AR days 45 to 55. On time delivery 92 to 96 percent on ocean. Cross any red flag threshold and margin bleed accelerates fast.
- A working BI stack is three dashboards, not one. The executive layer serves the CEO, COO, and CFO on margin, revenue per employee, top 5 customers, and AR trend. The operations layer serves the ops manager on on time rate, exceptions, container utilization, and ops cycle time. The sales layer serves the sales director on quote turnaround, conversion, pipeline, and customer trend.
- Refresh cadence is the single biggest gap on legacy KPI reports. Executive and sales dashboards should refresh daily. Operations dashboards should refresh hourly for shipment status and daily for volume rollups. Cost and margin data that refreshes monthly is already too old to act on.
- BI dashboards inside a freight management system outperform BI dashboards built on a spreadsheet export because the drill through goes back to the shipment record, the forecast vs actual is anchored to the booking file, and every KPI ties to a named user, a customer, a lane, and a period without a manual reconciliation step.
What Freight Forwarder BI KPIs Actually Are
Definition
Freight forwarder BI KPIs: the small set of measurable indicators, calculated from the shipment file and the general ledger, that a freight forwarder tracks on a business intelligence dashboard to see margin, cash, operational performance, and commercial health at a level of freshness fast enough to change decisions before the period closes.
The distinction between a KPI report and a BI dashboard is not cosmetic. A KPI report is a snapshot taken at a point in time, usually monthly, usually assembled by finance from an operational export. A BI dashboard is the same numbers pulled from the source system on a schedule fast enough to intervene while the shipment is still open, the quote is still in the customer's inbox, and the AR is still under the escalation threshold.
Every KPI on the 12 metric list below is a lagging indicator by design. Gross margin per shipment is only knowable after the invoice posts. On time delivery is only knowable after the shipment closes. AR days is only knowable against the invoice date. What the BI dashboard adds is the ability to see the lagging indicator on a rolling basis, spot the trend before the trend becomes the number, and act while the ops manager or sales director still has time to move it.
The 12 Freight Forwarder KPIs That Actually Matter
The list below is what a forwarder CFO or COO actually asks for when they say they want a KPI dashboard. Each row carries the definition, the formula the FMS or accounting system applies, the healthy benchmark range for a mixed ocean and air book, and the red flag threshold that should trigger an escalation.
| KPI | Definition | Formula | Healthy Benchmark | Red Flag Threshold |
|---|---|---|---|---|
| 1. Gross margin per shipment | Gross profit dollars a shipment generates after direct carrier and handling cost | Revenue minus direct cost, per shipment | $250 to $800 on mixed ocean and air | Below $150 signals margin bleed |
| 2. Gross margin percentage | Gross profit as a share of revenue | (Revenue minus direct cost) divided by revenue | 15 to 22 percent | Below 10 percent triggers pricing review |
| 3. Revenue per employee | Annual revenue divided by full time headcount | Trailing 12 month revenue divided by FTE count | $250K to $500K per year | Below $200K signals overhead too high |
| 4. Quote to book conversion rate | Share of quotes that turn into confirmed bookings | Bookings divided by quotes issued, same period | 25 to 40 percent | Below 15 percent means pricing or sales cycle issue |
| 5. Quote turnaround time | Elapsed time from RFQ received to quote sent | Median business hours from RFQ to quote | 4 to 8 business hours | Above 24 hours loses roughly 60 percent of bookings |
| 6. Booking to invoice cycle time | Days from booking confirmation to invoice posted | Median days, invoice date minus booking date | 30 to 45 days | Above 60 days signals ops process leak |
| 7. AR days outstanding (DSO) | Average days a customer takes to pay an invoice | (Accounts receivable divided by revenue) times days in period | 45 to 55 days | Above 70 days signals collection problem |
| 8. On time delivery rate | Share of shipments that hit the promised delivery window | On time shipments divided by total shipments closed | 92 to 96 percent ocean, above 97 percent air express | Below 88 percent ocean triggers customer churn |
| 9. Container or AWB utilization | Share of container or AWB capacity filled with revenue cargo | CBM or kg loaded divided by nominal capacity | 78 to 85 percent ocean FCL, 65 to 75 percent air consol | Below 60 percent burns unit economics |
| 10. Cost per shipment (all in ops cost) | All ops labor and system cost per shipment closed | Total ops cost divided by shipments closed, same period | Benchmarked against gross margin per shipment | Above 40 percent of gross margin per shipment |
| 11. Customer concentration | Share of revenue coming from the top 5 customers | Sum of top 5 customer revenue divided by total revenue | Below 40 percent | Above 40 percent flags concentration risk |
| 12. Vendor concentration | Share of cost flowing through the top 3 carriers | Sum of top 3 carrier spend divided by total carrier spend | Below 60 percent | Above 60 percent flags rate exposure risk |
Two things stand out from the benchmark set. First, the healthy ranges are tighter than most forwarders think. A forwarder running at 12 percent gross margin is already inside the red flag zone even though the number sounds acceptable at a distance. Second, the KPIs are correlated. Rising AR days pull down revenue per employee because the same headcount is chasing paperwork instead of shipments. Falling container utilization drags cost per shipment up because fixed handling is spread across less revenue cargo. A single KPI in isolation is a data point. The 12 together is a diagnosis.
BI Dashboard Layers by Role
One dashboard for the whole company does not work. The CEO does not need the container utilization tile that the ops manager lives on, and the ops manager does not need the top 5 customer revenue split that the CFO reviews weekly. A working BI stack for a forwarder splits into three dashboards by role, each pulling from the same source data with a refresh cadence that matches the audience.
| Dashboard Layer | Audience | Core Metrics | Refresh Cadence |
|---|---|---|---|
| Executive layer | CEO, COO, CFO | Gross margin percentage, revenue per employee, top 5 customer revenue split, AR trend, monthly close progress | Daily rollup, weekly trend, monthly close view |
| Operations layer | Operations manager, station manager | On time delivery rate, exception count, container or AWB utilization, booking to invoice cycle time, shipments per ops user | Hourly for status, daily for volume rollup |
| Sales layer | Sales director, account manager | Quote turnaround time, quote to book conversion, pipeline value, customer revenue trend, quote win rate by lane | Daily on quote and conversion, weekly on pipeline |
Every metric on every layer traces back to the same shipment file. The executive layer aggregates. The operations layer breaks down by shipment, lane, and user. The sales layer breaks down by customer, quote, and rep. When the three layers pull from the same source, the CFO can drill from a gross margin percentage tile on the executive dashboard down to the individual shipment on the operations dashboard without leaving the platform. That single drill through path is what a purpose built Freight Analytics Software for Forwarders provides that a spreadsheet stack cannot.
Executive Layer: What CEOs, COOs, and CFOs Watch
The executive dashboard is not a KPI menu. It is a set of five to seven tiles that answer one question at a glance: is the business hitting the target this month, and if not, where is the miss. Five metrics belong on almost every forwarder executive dashboard.
- Gross margin percentage, rolling 30 days. Trended against the target range of 15 to 22 percent, colored red when it drops under 12 percent for more than two consecutive weeks.
- Revenue per employee, trailing 12 months. Recalculated monthly, benchmarked against the $250K to $500K healthy range and against the prior year.
- Top 5 customer revenue split. Shown as a stacked bar for the current quarter, flagged when any single customer crosses 15 percent of total revenue.
- AR trend, rolling 90 days. DSO plotted week over week with the 45 to 55 day benchmark band, and a callout on any invoice over 90 days.
- Monthly close progress. Percentage of the shipment file with revenue and cost fully posted, updated daily during the close window.
Every one of these five tiles is a compound number. The CFO does not want to see the raw revenue figure. The CFO wants to see whether revenue divided by cost is holding the margin line, whether revenue divided by headcount is holding the productivity line, whether revenue is concentrated in a way that creates risk, whether cash is coming in on schedule, and whether the close will land clean. The executive dashboard converts the operational reality into those five business answers.
Operations Layer: The Ops Manager Dashboard
The operations dashboard runs at a completely different tempo. Where the executive dashboard is checked once a day, the operations dashboard is checked every couple of hours by the ops manager and constantly by the station lead running the exception queue.
Five metrics run the operations layer.
- On time delivery rate. Shown as a rolling 30 day percentage against the 92 percent ocean and 97 percent air targets, broken down by lane and carrier.
- Exception count, live. Number of open shipments with a documented exception (missing document, delayed vessel, cargo hold, ISF late risk, POD outstanding) refreshed hourly.
- Container or AWB utilization. Percentage of nominal capacity loaded on consol containers or air AWBs, benchmarked against the 78 to 85 percent ocean and 65 to 75 percent air ranges.
- Booking to invoice cycle time. Median days from booking confirmation to invoice posted, refreshed daily, flagged when any individual shipment crosses 60 days.
- Shipments per ops user, rolling 30 days. Volume load balancing metric, used to spot users at capacity before service quality slips.
The operations dashboard exists to change the day. When the exception count spikes past a threshold, the ops manager reassigns work before the shipments miss their windows. When utilization drops on a specific consol lane, the sales team pushes fill. When cycle time on a customer's book creeps up, the account manager gets a heads up before the customer complains. That intervention window only exists if the dashboard is fresh enough to show the state today, not the state last month.
Sales Layer: The Sales Director Dashboard
Sales dashboards are the most under built layer inside most forwarders because the data lives across the CRM, the quoting tool, and the FMS, and the reconciliation is manual. When the sales layer works, five metrics tell the sales director whether the pipeline is healthy.
- Quote turnaround time, median. Business hours from RFQ received to quote sent, benchmarked against the 4 to 8 hour healthy range, broken down by rep and lane.
- Quote to book conversion rate, rolling 30 days. Bookings divided by quotes issued, benchmarked against 25 to 40 percent, broken down by rep, customer, and lane.
- Pipeline value, weighted. Sum of open quotes multiplied by the conversion probability by stage, refreshed daily.
- Customer revenue trend. Rolling 90 day revenue by customer, flagged when a top 20 customer drops more than 25 percent versus the prior period.
- Win rate by lane. Conversion percentage by trade lane, used to spot lanes where the forwarder's rate or transit time has fallen out of the market.
The tie back to the operations layer matters here. A customer whose revenue trend is dropping usually shows a booking to invoice cycle time problem or an on time delivery issue on the operations dashboard first. When the sales director can drill from a customer revenue drop on the sales dashboard into the shipment history on the operations dashboard, the loss becomes fixable rather than terminal.
Why Spreadsheet KPIs Break at Scale
Almost every forwarder starts with a spreadsheet KPI report. It works up to a certain volume. Then it stops working, and the way it stops is consistent across forwarders.
Four failure modes show up.
- Monthly refresh, not daily. The KPI report is assembled during month end close from an operations export and an accounting export. By the time the report is circulated, the shipment that lost margin is 45 days old and the customer that stopped booking is already gone.
- No drill through. The spreadsheet shows the number but not the shipment. When the CFO asks why gross margin dropped, finance has to rebuild the query from scratch to find the shipments driving the miss.
- No forecast versus actual. The report shows what happened. It does not show what was supposed to happen. Without the target line, a bad month can pass as a normal month for weeks before anyone notices.
- Cost data lags 30 days. Direct cost postings usually trail the shipment because carrier invoices arrive weeks after the move. When cost is 30 days behind revenue, gross margin per shipment is at best an estimate for the current period.
These failure modes are not solvable inside the spreadsheet. They are solvable inside the source system. When the FMS holds the booking, the shipment, the cost accrual, and the invoice, the BI dashboard can pull all four at the same refresh cadence and give the CFO gross margin per shipment for the shipment that closed yesterday, not the shipment that closed in April.
Building a Daily Refresh Cadence
Refresh cadence is where BI dashboards inside a forwarder either work or do not. The right pattern splits by metric type.
Live or hourly. Shipment status counts, exception counts, ISF risk countdowns, and container utilization on active consols. These are operational metrics the ops manager acts on inside the day.
Daily rollup. Bookings issued, quotes sent, revenue posted, cost accruals recognized, cycle time medians, on time percentages. These are the metrics the executive and sales dashboards read every morning.
Weekly trend. Gross margin percentage, revenue per employee, customer revenue trend, pipeline value. These carry too much noise to read at the daily level but resolve cleanly at the weekly grain.
Monthly close. Full P&L by lane and by customer, revenue recognition adjustments, accruals reconciled to invoices, DSO adjusted for disputed items. These are the definitive numbers the CFO signs off after close.
The gap that kills most legacy KPI stacks is the missing daily rollup layer. Legacy stacks jump straight from live operational status to monthly close, with nothing in between. The daily rollup is what turns the shipment file into a business dashboard the sales director and the ops manager can act on before the month ends. A purpose built Ocean Freight Management Software that carries native BI keeps the daily rollup wired to the same shipment record the operations team edits, so every daily number the executive and sales layers read is anchored to the source truth rather than a reconciled export.
Where BI Dashboards Fit Inside a Freight Management System
The BI dashboard debate for forwarders splits into two design choices. Option one is a general purpose BI tool (Tableau, Power BI, Looker) sitting on top of an operational export. Option two is BI built inside the freight management system, reading the shipment file, the quote, the invoice, and the cost accrual live.
Both work at low volume. At scale, the second design outperforms because the data model is native. The BI dashboard inside the FMS does not need an ETL pipeline to reconstruct what a shipment is. It reads the shipment record directly. When the CFO clicks the gross margin per shipment tile, the drill through lands on the shipment screen with the booking, the invoice, the cost accrual, and the exceptions all visible. That drill path is what a general purpose BI tool cannot replicate cleanly because the reconstructed model in Tableau or Power BI is always a step removed from the operational reality inside the FMS.
The other advantage of native BI is invoice and AR integration. AR days outstanding is only trustworthy if the DSO calculation is running against the same invoice records the collections team is working. When BI and billing sit in the same platform, the DSO tile and the collections queue are looking at the identical dataset, which removes a whole class of reconciliation error. A modern Freight Billing & Accounting Software for Forwarders that shares its data model with the BI dashboard closes that loop.
Ship Faster. Scale Smarter. See how GoFreight surfaces the 12 forwarder KPIs on daily refresh BI dashboards wired to the shipment file, the invoice, and the cost accrual in one platform. Request a GoFreight Demo →
Frequently Asked Questions
What are the most important KPIs for freight forwarders to track?
Twelve KPIs cover almost every business question a forwarder needs to answer: gross margin per shipment, gross margin percentage, revenue per employee, quote to book conversion rate, quote turnaround time, booking to invoice cycle time, AR days outstanding, on time delivery rate, container or AWB utilization, cost per shipment, customer concentration, and vendor concentration. Gross margin per shipment and gross margin percentage answer the profitability question. Revenue per employee answers the productivity question. Quote to book conversion and quote turnaround answer the commercial health question. Booking to invoice cycle time and AR days answer the cash question. On time delivery and utilization answer the operational quality question. Customer and vendor concentration answer the risk question. Any KPI outside this 12 metric list is usually a subset or a decomposition of one of the twelve.
What is a healthy gross margin per shipment for a freight forwarder?
A healthy gross margin per shipment for a mixed ocean and air book runs $250 to $800. Ocean FCL shipments typically land at the low end of the range because the direct cost is dominated by carrier ocean rates. Air express shipments land at the high end because handling, security, and last mile add revenue per shipment. Any shipment closing under $150 in gross margin should be flagged as a margin bleed candidate for pricing review. The gross margin per shipment KPI only works when the direct cost accrual is current, which is why the BI dashboard needs to pull cost from the FMS accrual model rather than from posted carrier invoices that arrive weeks late.
What is the benchmark revenue per employee for a freight forwarder?
The healthy range for revenue per employee at a forwarder is $250K to $500K per year on a trailing 12 month basis. Small forwarders (under 20 FTE) usually run at the low end of the range because overhead is spread across a smaller book. Mid market forwarders (50 to 200 FTE) tend to hit the middle of the range. Larger forwarders with automated ops workflows and heavy digital investment can push toward and beyond $500K per FTE. Revenue per employee under $200K signals that headcount is running ahead of revenue, which is usually a symptom of manual workflows the FMS should be automating, weak account penetration, or lingering post growth headcount that was not right sized after a book contraction.
What is a good quote to book conversion rate for a freight forwarder?
A healthy quote to book conversion rate for a forwarder is 25 to 40 percent, tracked on a rolling 30 day basis. Conversion below 15 percent is a signal to check three things. First, quote pricing may be off market, especially on high volume lanes. Second, quote turnaround may be too slow, since bookings drop roughly 60 percent when turnaround crosses 24 hours. Third, the sales rep or the customer segment may need a review, because conversion can vary widely by rep and by customer maturity. Conversion above 50 percent is usually a signal that pricing is too soft on the win side and margin per shipment is under pressure, so both extremes matter.
How long should a freight forwarder take to turn around a quote?
Median quote turnaround time should sit at 4 to 8 business hours from RFQ received to quote sent. Turnaround under 4 hours is competitive on standard lanes and often decisive on repeat customers. Turnaround above 24 hours loses roughly 60 percent of the bookings the quote would otherwise have won, because the shipper has usually moved on to a second forwarder by then. Quote turnaround is one of the highest leverage sales KPIs on the dashboard because it is fixable inside the FMS through rate management automation, standing carrier contracts loaded once and reusable across quotes, and quote templates that pre populate accessorials by lane.
What is a healthy AR days outstanding (DSO) for a forwarder?
Healthy DSO for a forwarder runs 45 to 55 days. DSO under 45 days usually means the invoice terms are aggressive relative to the market and may be pushing customers toward competitors. DSO above 70 days is a collection problem that needs immediate escalation, because every additional day of DSO ties up working capital that the forwarder cannot deploy into carrier prepayments, bond capacity, or growth headcount. DSO is one of the KPIs where the BI dashboard has to sit on the same data model as billing, otherwise the DSO tile and the collections queue drift out of sync and the CFO ends up escalating the wrong invoices.
How do freight forwarders measure on time delivery rate?
On time delivery rate is measured as the percentage of shipments that hit the promised delivery window, calculated as on time shipments divided by total shipments closed in the same period. Healthy benchmarks vary by mode. Ocean forwarders should hit 92 to 96 percent, with the top quartile pushing above 96 percent. Air express should hit above 97 percent because the customer paying air premium expects a tighter window. On time delivery under 88 percent on ocean is a customer churn risk because shippers will move volume to a competitor with better performance after two or three missed windows. The KPI only works if the delivery window is set from the customer confirmation and not from the forwarder's internal estimate, so the FMS needs to lock the promised date at booking time.
What is the difference between container utilization and AWB utilization?
Container utilization is the share of nominal container capacity filled with revenue cargo on a consol container. On ocean FCL, healthy utilization is 78 to 85 percent measured by CBM. AWB utilization is the same concept for air, calculated on chargeable weight (the higher of gross weight and volumetric weight) as a percentage of AWB capacity. Healthy air consol utilization is 65 to 75 percent because air consols tolerate less density than ocean containers. Both KPIs matter for unit economics. When utilization drops under 60 percent, the fixed handling cost per shipment rises fast and margin per shipment on the consol book erodes. Container and AWB utilization should live on the operations dashboard because they are actionable inside the same day through fill push and rate adjustments.
What is customer concentration risk for a freight forwarder and how do you measure it?
Customer concentration is the share of total revenue coming from the top 5 customers. The healthy threshold is below 40 percent. Above 40 percent, the loss of a single top customer can wipe out a quarter of the forwarder's book and force headcount cuts. The KPI belongs on the executive dashboard because customer concentration is a strategic risk, not an operational one. The mitigation is not to fire large customers, it is to grow the mid market book fast enough to dilute the concentration ratio. The BI dashboard supports that by showing customer revenue trend alongside customer concentration, so the sales director can see whether the concentration ratio is improving through mid market growth or worsening through a top customer taking more share.
What BI dashboard should a freight forwarder CFO look at daily?
The CFO daily dashboard is the executive layer, focused on five tiles: gross margin percentage on rolling 30 days, revenue per employee on trailing 12 months, top 5 customer revenue split for the current quarter, AR trend on rolling 90 days, and monthly close progress during the close window. Each tile is a compound number that answers a business question rather than a raw metric. Gross margin percentage answers whether the pricing discipline is holding. Revenue per employee answers whether headcount is right sized. Top 5 revenue split answers whether concentration risk is building. AR trend answers whether cash is coming in on schedule. Monthly close progress answers whether the numbers will land clean and on time. Every tile drills through to the underlying shipments so the CFO can move from a tile to a specific shipment or customer in one click.
What BI dashboard should an operations manager use daily?
The operations manager dashboard is the operations layer, focused on live on time delivery rate, open exception count, container or AWB utilization on active consols, booking to invoice cycle time on the current book, and shipments per ops user for volume load balancing. The dashboard refreshes hourly for status metrics like exceptions and utilization, and daily for volume rollups like cycle time. The ops manager uses the dashboard to intervene inside the day. When exception count spikes past a threshold, work gets reassigned before shipments miss windows. When utilization drops on a specific consol lane, sales gets a fill push request. When cycle time creeps up on a customer's book, the account manager gets a heads up before the customer complains. The intervention window only exists if the dashboard is fresh enough to show the state today.
Why do spreadsheet based KPI reports break down as a forwarder scales?
Spreadsheet KPI reports break at scale in four consistent ways. Refresh happens monthly during close rather than daily, so the shipment that lost margin is already 45 days old when the report is circulated. Drill through is missing, so the report shows the number but not the shipments driving it and finance has to rebuild the query manually. Forecast versus actual is missing, so a bad month passes as a normal month until the trend is undeniable. Direct cost data lags 30 days because carrier invoices arrive weeks after the shipment, so gross margin per shipment is at best an estimate for the current period. None of these failure modes are solvable inside the spreadsheet. They are solvable by pulling the BI dashboard from the same source system that holds the booking, the shipment, the cost accrual, and the invoice.
Do freight management platforms have BI dashboards built in?
Purpose built forwarder FMS platforms increasingly include native BI dashboards that read the shipment file, the quote, the invoice, and the cost accrual directly. The advantage over a general purpose BI tool (Tableau, Power BI, Looker) sitting on top of an operational export is the drill through path. When the CFO clicks a gross margin per shipment tile, the drill through lands on the shipment record with the booking, the invoice, the cost accrual, and the exceptions all visible in one screen. A general purpose BI tool always sits one step removed from the operational reality inside the FMS because the data model in Tableau or Power BI is reconstructed from an export. Both patterns work at low volume. At scale, native BI wins because the drill through, the forecast versus actual, and the AR reconciliation all sit on the same data model as the operational team's daily work.
How often should freight forwarder BI KPIs refresh?
Refresh cadence should split by metric type. Live or hourly for shipment status, exception counts, ISF risk countdowns, and utilization on active consols. Daily rollup for bookings issued, quotes sent, revenue posted, cost accruals, cycle time medians, and on time percentages. Weekly trend for gross margin percentage, revenue per employee, customer revenue trend, and pipeline value. Monthly close for full P&L by lane and customer, revenue adjustments, accrual reconciliation, and DSO adjusted for disputes. The single biggest gap on legacy KPI stacks is the missing daily rollup. Legacy reports jump from live operational status straight to monthly close with nothing in between, which is why the sales and executive dashboards go stale between month ends. The daily rollup is what turns the shipment file into a business dashboard the sales director and ops manager can act on before the month closes.